Several potential causes seem to exist.
From the screenshots you posted we know two important facts:
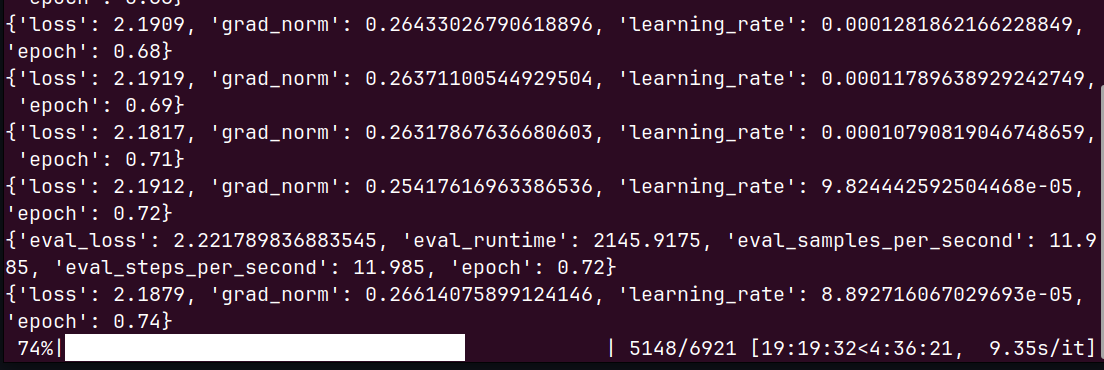
- Evaluation really runs: the terminal shows a log dict with
'eval_loss': 2.22..., 'eval_runtime': ....
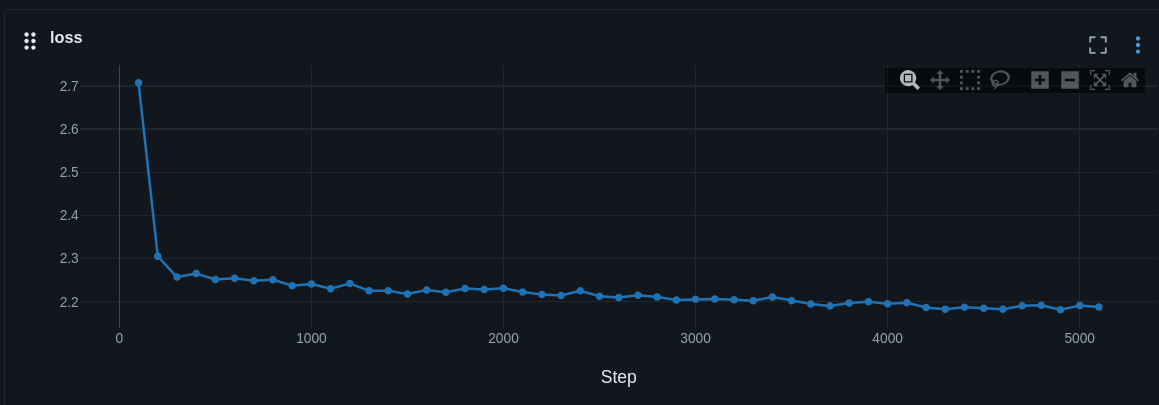
- Training is logged to MLflow: you see a smooth
loss curve in the MLflow UI.
So the model does compute validation loss, but MLflow only shows the training metric you’re looking at.
Below is a detailed breakdown of how this logging pipeline works, what typically goes wrong in situations exactly like this, and what to do in each case.
1. How Hugging Face → MLflow logging actually works
-
You create TrainingArguments(..., report_to=["mlflow"]).
-
Transformers attaches an MLflowCallback to the trainer. This callback’s on_log method receives every log dict that Trainer emits and calls mlflow.log_metrics on all numeric entries. (mlflow.org)
-
During training you get log dicts like:
{'loss': 2.18, 'grad_norm': 0.26, 'learning_rate': 8.9e-5, 'epoch': 0.74}
-
During evaluation (triggered by eval_strategy="steps" + eval_steps=500) you get log dicts like:
{'eval_loss': 2.22, 'eval_runtime': 2145.9,
 'eval_samples_per_second': 11.98, 'eval_steps_per_second': 11.98,
 'epoch': 0.72}
Your terminal screenshot shows exactly such a dict, so step (4) is definitely happening.
-
MLflow stores each metric name as its own time series keyed by step. So:
loss → training curveeval_loss → validation curve
This is the same mechanism used in MLflow’s own Transformers fine-tuning tutorial; their logs also contain both loss and eval_loss and both appear as separate metrics in the MLflow UI. (mlflow.org)
2. Most common, very simple cause
2.1 You are only plotting loss, not eval_loss
In MLflow, each metric has its own chart:
- The chart labeled
loss shows only training loss.
- The chart labeled
eval_loss shows only evaluation loss.
- MLflow does not automatically overlay
eval_loss on the loss plot.
This is different from the course screenshots, which use Weights & Biases; W&B makes it easy to overlay multiple metrics on the same plot by default. MLflow’s default “single metric per chart” UI leads to exactly the confusion you’re describing.
What to check
- Open the run in MLflow.
- Go to the Metrics tab.
- In the metric list, look for a metric called
eval_loss in addition to loss, grad_norm, learning_rate, etc.
- Click on
eval_loss. That chart should show your sparse validation points (one every eval_steps).
If eval_loss is in that list, then nothing is broken:
- You do have validation logging.
- You just need to select the
eval_loss metric (or compare metrics in a separate view) instead of only looking at the loss chart.
3. If eval_loss is truly missing as a metric
If you do not see eval_loss in MLflow’s metric list, but you do see it printed in the terminal, then:
- Transformers is computing and logging evaluation internally.
- Those eval logs are not being forwarded to MLflow as metrics.
There are a few realistic causes for that.
3.1 MLflow callback not active or partially disabled
HF logging to MLflow only works if MLflowCallback is attached. (mlflow.org)
This can fail if:
- You override
callbacks when constructing the trainer and forget to add MLflowCallback.
- The environment variable
DISABLE_MLFLOW_INTEGRATION is set, which disables the built-in callback.
- You’re using a wrapper (
SFTTrainer, a custom trainer) that replaces the callback handler.
How to confirm
After building the trainer:
print(trainer.callback_handler.callbacks)
You should see something like <transformers.integrations.MLflowCallback object at ...> in that list.
If you don’t:
from transformers.integrations import MLflowCallback

trainer = Trainer(
    model=model,
    args=training_args,
    train_dataset=train_ds,
    eval_dataset=eval_ds,
    callbacks=[MLflowCallback()],  # plus any other callbacks you want
)
Now both training and eval logs should be forwarded to MLflow.
3.2 You are using TRL SFTTrainer + PEFT/LoRA and the trainer was mis-configured
For LoRA + TRL SFTTrainer there have been several issues where evaluation loss was not computed at all, due to trainer.can_return_loss being set to False when the model’s forward did not accept a return_loss argument. (GitHub)
In those cases:
- No
eval_loss appears in the evaluation logs (terminal or log_history).
- MLflow cannot log what doesn’t exist.
Workaround from those issues:
trainer = SFTTrainer(...)

# After trainer is created, before trainer.train():
trainer.can_return_loss = True
Along with, for some LLMs, explicitly setting label_names in TrainingArguments (often to an empty list for causal LMs): (Hugging Face Forums)
training_args = TrainingArguments(
    ...,
    label_names=[],  # for causal LM style SFT
)
However, your terminal screenshot already shows 'eval_loss': 2.22..., so your trainer is computing eval loss. That means this particular “no eval_loss at all” bug is probably not what you’re seeing, but it’s a common gotcha in similar LoRA/SFT setups.
3.3 Evaluation metrics never reach the callback, but exist in log_history
All logs that the Trainer emits are stored in trainer.state.log_history. That list will contain dicts for both training and evaluation. (Hugging Face Forums)
After training:
for entry in trainer.state.log_history:
    if "eval_loss" in entry:
        print(entry)
        break
Cases:
-
If you see entries with eval_loss, then Trainer is logging evaluation correctly.
- If MLflow still has no
eval_loss metric, the MLflow callback is not firing for eval logs → fix callback configuration as in 3.1.
-
If you don’t see any eval_loss entries in log_history, then evaluation loss is never actually passed into Trainer.log; your terminal log might be coming from a custom callback or custom print. MLflow cannot see these, so you need to either:
- Fix the trainer so it goes through
Trainer.log, or
- Log eval loss to MLflow manually (next section).
4. Robust: explicitly log eval loss from log_history
Even if you never figure out which callback is mis-configured, you can always recover both curves from trainer.state.log_history and push them into MLflow yourself. This pattern is also what many people use when working around logging bugs. (Hugging Face Forums)
Example:
import mlflow

# ... build trainer & train ...
trainer.train()

for i, entry in enumerate(trainer.state.log_history):
    step = entry.get("step", entry.get("global_step", i))

    if "loss" in entry:
        mlflow.log_metric("loss", entry["loss"], step=step)

    if "eval_loss" in entry:
        mlflow.log_metric("eval_loss", entry["eval_loss"], step=step)
Then in MLflow you will definitely have both loss and eval_loss metrics, regardless of what the built-in callback did.
5. Sanity checks specific to your arguments
Your TrainingArguments:
training_args = TrainingArguments(
    output_dir="../model/lora",
    per_device_train_batch_size=1,
    learning_rate=5e-4,
    logging_steps=100,
    save_steps=2000,
    per_device_eval_batch_size=1,
    eval_strategy="steps",        # correct name on recent transformers
    eval_steps=500,
    gradient_accumulation_steps=8,
    num_train_epochs=1,
    weight_decay=0.1,
    warmup_ratio=0.05,
    lr_scheduler_type="cosine",
    fp16=False,
    report_to=["mlflow"],
    run_name=timestamp,
)
Notes:
- On new Transformers versions,
evaluation_strategy was renamed to eval_strategy; your usage is consistent with the new API. (GitHub)
eval_strategy="steps" + eval_steps=500 will produce one eval log roughly every 500 optimization steps (i.e., after gradient accumulation).logging_steps=100 controls how often training loss is logged. It doesn’t affect the frequency of eval logs.
Given that:
- You see
{'eval_loss': ...} in the terminal → evaluation is running and producing a metric.
- You see a smooth
loss curve in MLflow → Trainer logs are reaching MLflow.
- The remaining question is visibility (are you clicking
eval_loss?) or callback wiring (is MLflowCallback actually attached?).
6. Summary of causes and fixes
Cause A – eval_loss is there but you are only plotting loss
Symptom: eval_loss appears in the MLflow metric list, but you only opened the loss chart.
Fix:
Open the Metrics tab → click the eval_loss metric → optionally compare metrics or download data and plot both curves together.
Cause B – MLflow callback not attached or disabled
Symptom: loss is logged in MLflow, but no eval_loss metric; trainer.state.log_history contains eval entries.
Fix:
from transformers.integrations import MLflowCallback

trainer = Trainer(
    model=model,
    args=training_args,
    train_dataset=train_ds,
    eval_dataset=eval_ds,
    callbacks=[MLflowCallback()],
)
And ensure DISABLE_MLFLOW_INTEGRATION is not set in the environment.
Cause C – Trainer never passes eval loss into the logging pipeline
Symptom: Terminal prints something custom; trainer.state.log_history has no eval_loss entries.
Fix options:
-
If you’re using TRL SFTTrainer + PEFT/LoRA and running into a known bug where eval loss is not computed, set:
training_args = TrainingArguments(..., label_names=[])
trainer.can_return_loss = True
(GitHub)
-
As a robust fallback, log from log_history manually with mlflow.log_metric("eval_loss", ...) as shown above.
If you walk through:
- “Is there an
eval_loss metric in MLflow’s Metrics tab?”
- “Does
trainer.callback_handler.callbacks include MLflowCallback?”
- “Does
trainer.state.log_history actually contain eval_loss entries?”
you will be able to pinpoint which of these causes is affecting your run and apply the corresponding fix.